
Будуємо простий GraphQL API сервер express і nodeJS
Пропоную вільний переклад невеликої статті щодо практичного застосування GraphQL.
GraphQL це мова запитів для API, який пропонує декларативний підхід до отримання даних. Він дозволяє клієнтам запитувати тільки потрібні дані з веб-сервера і нічого зайвого. Розроблений ще в 2012 році facebook’ом, яким раніше і підтримується, GraphQL став використовуватися багатьма іншими великими і не дуже компаніями. Серед інших Yelp, Shopify і Github.
При використанні REST APIs зазвичай запити надсилаються за кількома адресами, для отримання всіх необхідних даних у додатку. GraphQL API дозволяє тобі відправляти всі запит за адресою із зазначенням, які саме дані ти би хотів отримати цим запитом. Тому, до речі, GraphQL відмінно підходить при використання в умовах повільного мобільного з’єднання.
Версії API можуть бути головним болем для команд розробників. З GraphQL ви можете з цим не перейматися. GraphQL дозволяє тобі додати нові поля і типи (це буде обговорюватися пізніше) в твій GraphQL API, не зачіпаючи існуючі запити, старі і непотрібні поля можуть бути прихованими від клієнтів API. Використовуючи єдину эволюционирующую версію, GraphQL API надає вашому додатку постійний доступ до нових реалізацій API і забезпечують чистий і легко підтримувану базу коду.
Попереднє вимога
Перед початком переконайтеся, що у вас встановлено Node версії 6 і старше. Версію можна перевірити командою:
node -vЯкщо у вас не встановлена Node, перейдіть по URL: https://nodejs.org/ і дотримуйтесь іструкція по установці.
Налаштування GraphQL і Express
Простим способом створення Graph API сервера є використання Express, популярного фреймворку для Node.js. Встановлюємо Express з допомогою npm:
npm init
npm install express --save
Потім встановлюємо `graphql` і `express-graphql`:
npm install graphql express-graphql --save Отже, початкова структура папок буде наступна:
|---- node_modules
 |---- package.json
Швидкий старт в GraphQL API
В цьому невеликому розділі ми попытаем швидко створити просте GraphQL API. Це важливо для подальшого оповідання, щоб вам стало ясно, що саме ми робимо, що з себе представляє API, створене з допомогою GraphQL. Якщо деякі моменти будуть здаватися складними і незрозумілими, не турбуйтеся, ми до них ще повернемося.
Отже, зараз ми збираємося використовувати об’єкт `buildSchema` з `graphql` для створення схеми (‘schema’). Створюємо файл example.js у нашій папці.
const express = require('express');
const { buildSchema } = require('graphql');
const graphqlHTTP = require('express-graphql');
let port = 3000;

/* Це проста схема побудована з использванием
 мови схеми GraphQL */

let schema = buildSchema(`
 type Query {
 postTitle: String,
 blogTitle: String
}
`);

/* root надає функції розпізнання для кожного
 endpoint'a */

let root = {
 postTitle: () => {
 return 'Build a Simple GraphQL Server With Express and NodeJS';
},
 blogTitle: () => {
 return 'scotch.io';
}
};

const app = express();
app.use('/', graphqlHTTP({
 schema: schema,
 rootValue: root,
 graphiql: true // Якщо true, то відображає GraphiQL
})); // (браузерна IDE для створення і выполненения запитів до endpoint'ам),
 // коли endpoint'и GraphQL були завантажені

app.слухати(port);
console.log('GraphQL API server running at localhost:' + port);
Тепер ви можете запустити `example.js` в терміналі:
node example.jsТепер на localhost:3000 ви зможете виявити GraphiQL. Він дозволить вам перевірити ваш API в браузері. Він підтримує автозаповнення і робить припущення для вас на основі типів і полів, доступних у вашій схемі.

Зараз давайте попросимо нашу схему для `blogTitle`:

Ось так просто ви можете запитати API GraphQL’а.
Введення
Тепер ви розумієте, як GraphQL працює і можемо почати тему глибше.
Почнемо з створення GraphQL сервера на основі Express. Тепер, у нашій папці створіть папку `src`, а в ній створіть і збережіть файл `schema.js`. Цей файл буде виглядати так:
// Authors і Posts отримують дані у вигляді
// JSON масивів з відповідних файлів
const Authors = require('./data/authors');
const Posts = require('./data/posts');

let {
 // Тут базові типи GraphQL, які потрібні в цьому уроці
GraphQLString,
GraphQLList,
GraphQLObjectType,
 /* Це необхідно для створення вимог
 до полів і аргументам */
GraphQLNonNull,
 // Цей клас нам потрібен для створення схеми
GraphQLSchema
} = require('graphql');
Далі створіть папку `data` в папці `src`. У неї ми розмістимо 2 файлу: ‘authors.js’ і ‘posts.js’.
Вміст цих файлів досить велика, тому не взяти їх можете за посиланням на Github або під спойлером.
authors.js
const Authors = [
{
 id: '8dlx7ak38fd39dv79ad',
 name: 'Orinami Olatunji',
 twitterHandle: '@orinami_'
},
{
 id: 'jd3kd03d0w9a0l35rh74',
 name: 'Ojima Udale',
 twitterHandle: '@uncooloj'
},
{
 id: '0hy894hf0dlkfh9oinv',
 name: 'Xabi Alonso',
 twitterHandle: '@alonso'
}
];

 module.exports = Authors;
posts.js
const Posts = [
{'id':'0176413761b289e6d64c2c14a758c1c7','author_id':'0hy894hf0dlkfh9oinv','author':'alonso', 'category':'meteor','body':'Most developers and companies use two different apps for the marketing website and for the app itself. Thus, they can update each of the apps without affecting the other. [Stripe](https://stripe.com/), [Digital Ocean](https://www.digitalocean.com/) and many other companies follow this technique. Most Meteor apps also do the same.nnSo, in a scenario like this, sometimes we need to show the login state of the app on the landing page too. For an example, see our Kadira home page (u003chttps://kadira.iou003e). If you are logged into the Kadira app (u003chttps://ui.kadira.iou003e), we show a button with "Open Kadira UI" on the home page, which replaces the login button.nn[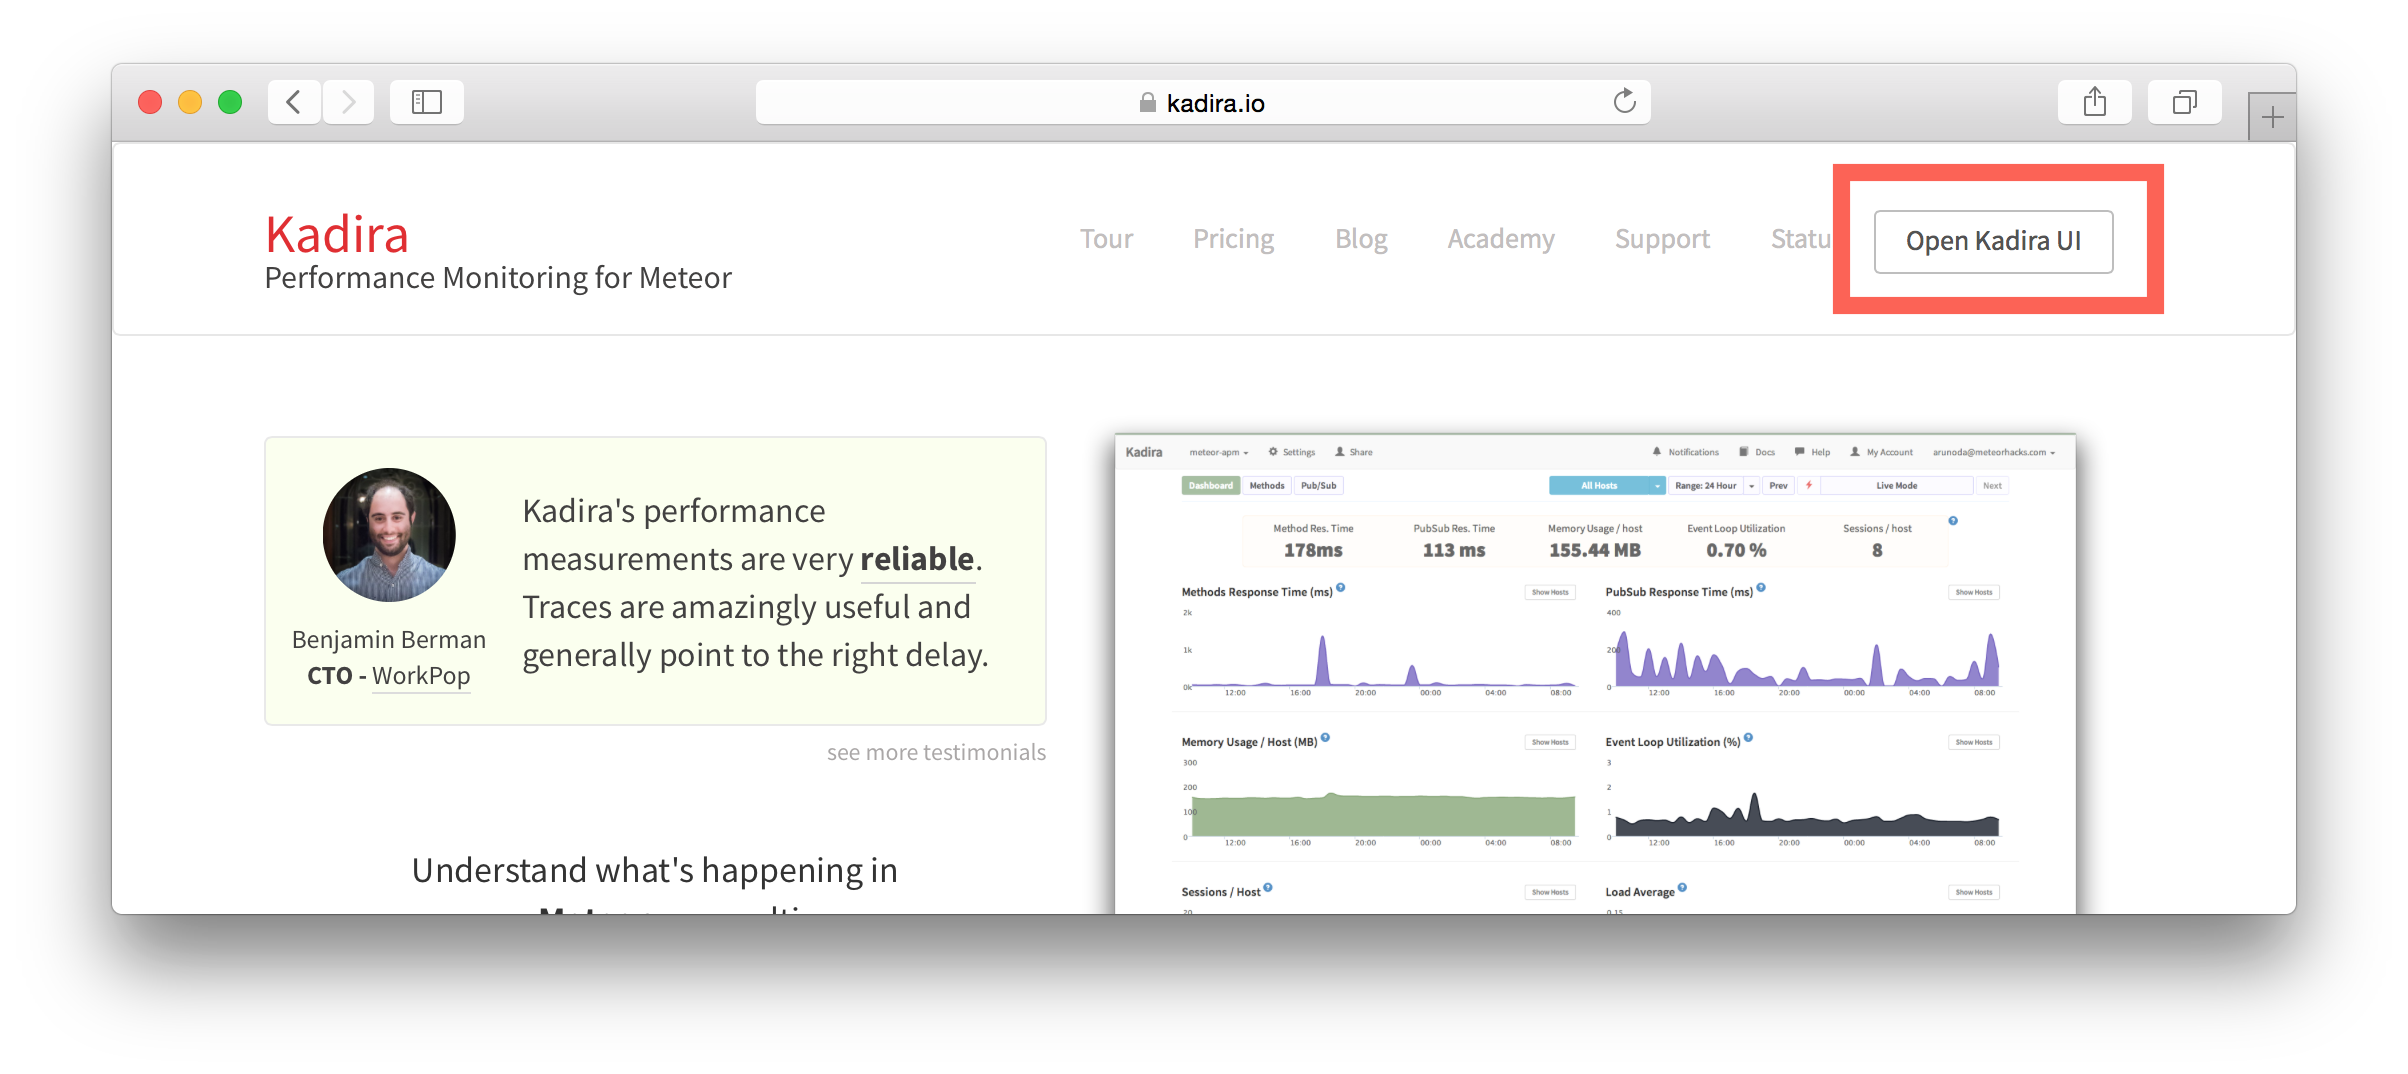](https://kadira.io)nn## How Did We Do It?nnMeteor does not have a built-in way to share login states across multiple apps or subdomains. So, we have to find an alternative way to do so.nnAs a solution, we can use browser cookies to share the login state between multiple domains. That's exactly what we did. We wrapped up this into a Meteor package, which now you can also use.nnIn this guide, I'm going to explain how to share the login state between multiple domains using the [`kadira:login-state`](https://github.com/kadirahq/meteor-login-state) package.nn### On Meteor AppnnFirst of all, install the `kadira:login-state` package in your Meteor app:nn~~~nmeteor add kadira:login-staten~~~nnThen, you need to add a new entry in the `public` object as the `loginState` in the `settings.json` file for your app. (If you haven't created the settings.json yet, you need to create it first.)nn~~~jsonn{n "public": {n "loginState": {n "domain": ".your-domain-name.com"n "cookieName": "app-login-state-cookie-name"n }n }n}n~~~nnThe `domain` field must be your main domain name, starting with a dot. It allows you to share the login state, which can be accessed from any of its subdomains. You can use any appropriate identifier, such as `cookieName`.nnNow, everything has been set up on the Meteor app.nn### On the Static App (the Landing Page)nnNow we have to show the login state of the app on the landing page. For this, we need to add support for the login state for the static app (or landing page).nnActually, there are three different ways to do this. Here I will show you how to do so by pasting a few lines of JavaScript code.nnYou need to create a JavaScript file in your js folder. I create it as `js/login_state.js`. After that, copy and paste the following code snippet into it:nn~~~javascriptnLoginState = {};nnLoginState.get = function(cookieName) {n var loginState = getCookie(cookieName);n if(loginState) {n return JSON.parse(decodeURIComponent(loginState));n } else {n return false;n }n};nnfunction getCookie(cname) {n var name = а + "=";n var ca = document.cookie.split(';');n for(var i=0; i u003c ca.length; i++) {n var c = ca[i];n while (c.charAt(0)==' ') c = c.substring(1);n if (c.indexOf(name) != -1) return c.substring(name.length,c.length);n }n return;n}n~~~nnInsert that file into the head section of your HTML document: nn`u003cscript src="js/login-state.js"u003eu003c/scriptu003ennu003e If you prefer, you can also use [Browserify](https://github.com/kadirahq/meteor-login-state#installing-via-browserify) or [Bower](https://github.com/kadirahq/meteor-login-state#installing-via-bower) to load the above JS file.nu003e The package name for both Browserify and Bower is `meteor-login-state`.nnThen, use the following code to get the login state of your app. You need to provide the relevant `cookieName` to do so: nn~~~javascriptnvar loginState = LoginState.get("app-login-state-cookie-name");nif(loginState) {n // the user has loggedIn to the meteor appn // see the loginState Object for the addtional datan // (append your code here!)n console.log(loginState);n} else {n // user has not loggedIn yet.n // (append your code here!) n}n~~~nnThe `loginState` object will be something like this:nn~~~jsonn{n timestamp: 1435835751489,n username: "username",n userId: "meteor-user-id",n email: "user@email.com"n url: "https://ui.kadira.io"n}n~~~nnNow you can do whatever you need to do with the login state.nnGive it a try and let me know what you think.','date':{'$date':'2015-07-07T00:00:00.000 Z'},'layout':'blog_post','slug':'sharing-meteor-login-state-between-sub-domains','summary':'In this we blog'll show you how we shared login state between our static web app and our Meteor app Kadira UI.','title':'Sharing the Meteor Login State Between Subdomains'},
{'id':'03390abb5570ce03ae524397d215713b','author_id':'0hy894hf0dlkfh9oinv','author':'alonso', 'category':'огляд','body':'Here is a common feedback we received from our users:nnu003e Hi, I have a suggestion. It would be great if I could "dismiss" errors or mark them as resolved on my end. This way, I can keep track of which errors I have resolved.nnToday we are happy to announce new Kadira feature which allows you to track **status** to errors. With that, you can mark errors as "Ignored", "Fixing" or "Fixed".nnOnce you mark as an error "Ignored", it will be hidden. nnBut you can click on "Show Ignored Errors" checkbox or filter by "ignored" status to view them again.nn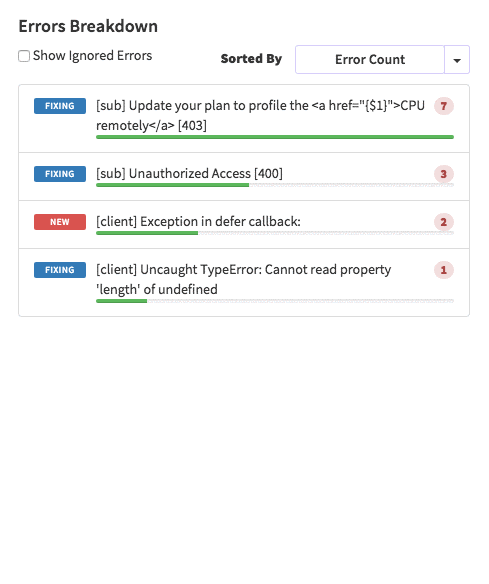nnYou can also filter errors by status like this:nn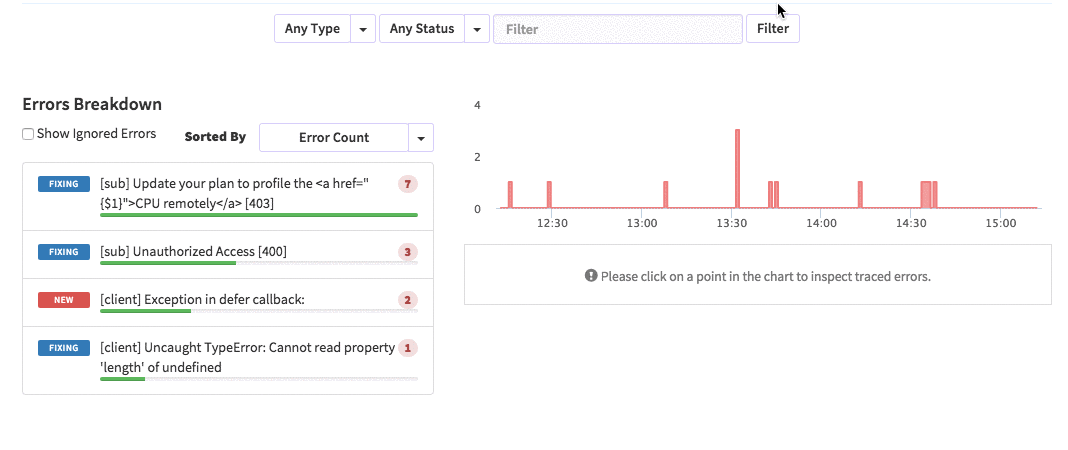nnWe are rolling out this feature to all our paid users. [Give it a try](https://ui.kadira.io/apps/AUTO/errors/overview?metric=count).nn### what's next?nnRight now we are planning to add few more feature related this. Could you help us on [prioritizing](https://orinami.typeform.com/to/hyTwsy) them? Trust me, [it won't take a minute](https://orinami.typeform.com/to/hyTwsy).','date':{'$date':'2015-09-01T00:00:00.000 Z'},'slug':'tracking-error-status-on-kadira','summary':'Lot of users asked us to add a feature to set status for errors in the Kadira Error Manager. Now, we've that functionality.','title':'New Feature: Tracking Error Status with Kadira'},
{'id':'0be4bea0330ccb5ecf781a9f69a64bc8','author_id':'8dlx7ak38fd39dv79ad','author':'orinami', 'category':'огляд','body':'u003cscript type="text/javascript" src="https://gumroad.com/js/gumroad.js"u003eu003c/scriptu003ennWe are working on the next few major feature releases for Kadira. We would like to know your preference. Pre-order the feature you would like most to see in the next major release (scheduled for August 1).nn## Real Client MonitoringnnWith Real Client Monitoring, you can learn how your app behaves in actual clients and find client-side bottlenecks. You'll be able to see:nn* Load time of your appn* Time taken to connect to the DDP Servern* Time taken to load the initial subscriptionsn* Time taken to render initial subscriptionsn* Latency values for your methods and publications. You can also break them down into:n * Network latency for sending requestsn * Server queue timen * Server processing timen * Network latency for receiving result/datannComparisons with all of these metrics can be made against countries and browsers (mobiles, desktop, etc.).nnu003e This is an add-on for your app and we charge [**$25 for 50K DDP connections per month**](https://gumroad.com/l/LyDy). You can also enable this add-on even if you have a free plan.nu003enu003e 1 DDP connection = 1 Reatime client who established a DDP connectionnnu003ca href="https://gumroad.com/l/LyDy" class="gumroad-button"u003ePre Order Now!u003c/au003enn## CPU/Memory ProfilingnnYou'll be able to create CPU and memory profiles for your app in both development and production. This is an add-on for your app.nnThe add-on shows:nn* CPU-intensive packages in your appn* CPU-intensive functions and who created themn* Capture and compare heap dumps and learn how to find memory leaks with themnnu003e You can enable this add-on for a [**$20/month**](https://gumroad.com/l/EqEf) flat free for you app. You can also enable this add-on even if you have a free plan.nnu003ca href="https://gumroad.com/l/EqEf" class="gumroad-button"u003ePre Order Now!u003c/au003enn## Better Manager ErrornnCurrently, we track errors methods for only. With Error Manager, you'll be able to track all the server-side and client-side errors.nnThe improved Error Manager will be available for any app with a [**paid plan**](https://gumroad.com/l/fRGA).nnu003e Client-side errors will be routed through your app. In future, you'll be able to send them directly to Kadira routing without them through your app.nnu003ca href="https://gumroad.com/l/fRGA" class="gumroad-button"u003ePre Order Now!u003c/au003e','date':{'$date':'2014-06-30T00:00:00.000 Z'},'layout':'blog_post','slug':'what-should-kadira-build-next','summary':'We are working on the next few major feature releases for Kadira. We would like to know your preference. Pre-order the feature you would like most to see in the next major release (scheduled for August 1).','title':'What Should Kadira Build Next?'},
{'id':'19085291c89f0d04943093c4ff16b664','author_id':'8dlx7ak38fd39dv79ad','author':'orinami', 'category':'огляд','body':'Everybody hates errors -- whether it's in a Meteor app or not. Unfortunately, errors are something we can't avoid. So we must track and handle errors even though, we have tested our app a lot.nnIn the recent past, technology has been changed rapidly. But, how we track and fix errors hasn't changed that much specially for apps running live on production.nnTake a look at the following process. It's the process we often used to track and fix errors.nn* Capture errors via either logs or using some third party web service.n* Look for error message and stack trace.n* Try to locate the relevant place in the code.n* Then try to fix it.nnI don't think I need to talk more about this because we all follow the same process.nn### Client Side ErrorsnnManaging server side errors is pretty easy compared with client side errors. For server errors all we need to focus on our servers. But tracking client side errors is not that simple.nnAlso, we can't really depend on stack traces because of the minified code. Even though we capture errors, it's not easy as server side errors due to the vendor specific issues and constraints. nn## Let's fix this!nnSo, we've decided to find a cure for this and found a way.nnWhat we are doing is pretty simple. Along with capturing the error, we also capture the **context** and **events** related to the error. Then you can reproduce them in your development environment and identify and fix any issues quickly.nnCheck following error trace which has been captured with Kadira.nn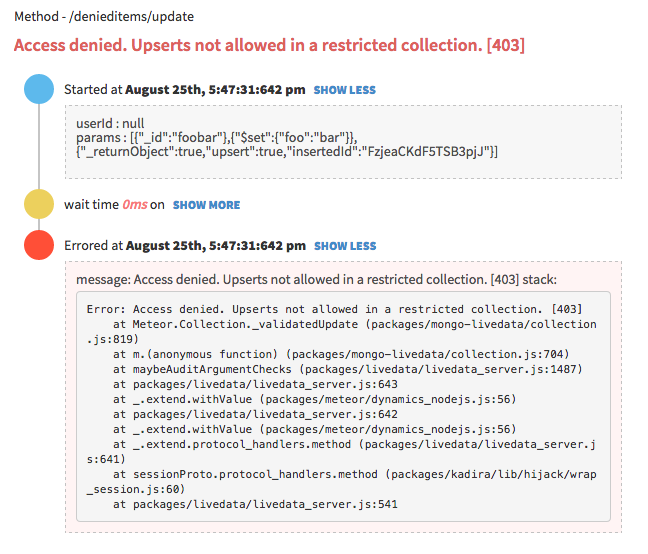nnIt contains:nn* input parameters for the error;n* user who's got this error;n* all the DB, HTTP and other events that have occurred; andn* the error message and the stack trace.nnNow it's super-easy to fix the error since you can clearly see what cause the error and it's context. We track all kinds of errors including pubsub, method, uncaught exceptions and internal Meteor errors.nn### What About Client Side Errors?nnWe do the same for client side errors as well. Look at the following error trace.nn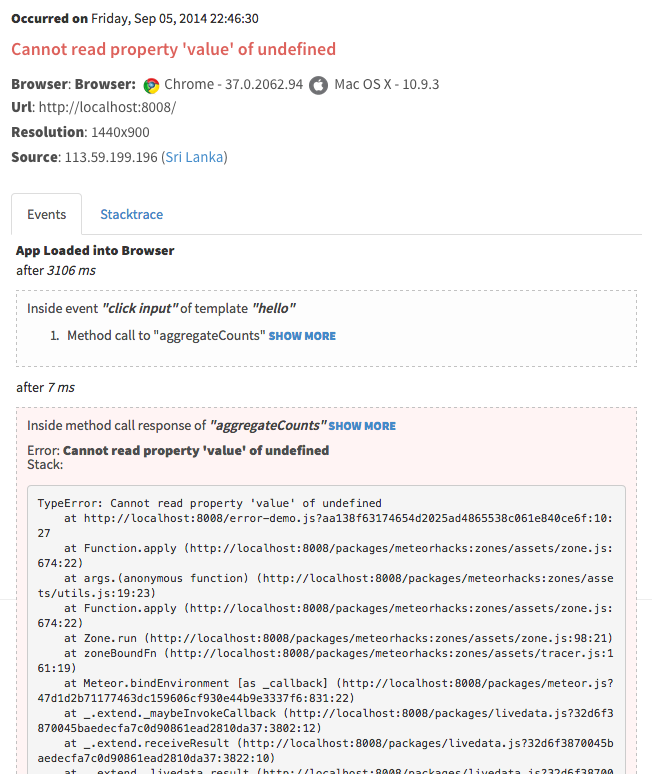nnIt has:nn* browser information;n* user information; n* all the Meteor method calls, subscriptions, sessions and all related events that have occurred;n* a complete flow of the error starting from the page load event; andn* the actual error message and stack trace.nnNow I think you know what to do with this information.nnu003e we track events using client side zones. So, you need to add [`zones`](https://github.com/meteorhacks/zones) package into your app in addition to [`kadira`](https://github.com/meteorhacks/kadira). Otherwise, you can't see events.nn## Public BetannToday, we are happy to announce the public beta of the Kadira's Error Tracking and solution invite all of you to start tracking errors with Kadira.nnWe've worked so hard on this over the last few months and a lot of people have helped us to test our error tracking solutions—thank you! nnSimply update the [`kadira`](https://github.com/meteorhacks/kadira) smart package and visit Errors section on the [Kadira UI](https://ui.kadira.io/).nnnnu003e Error Tracking is free and unrestricted throughout public beta period.nnGive it a try and let us know how it goes.','date':{'$date':'2014-09-08T00:00:00.000 Z'},'layout':'blog_post','slug':'awesome-error-tracking-solution-for-meteor-apps-with-kadira','summary':'Error tracking is so much important and goes side by side with performance issues. This is the public beta announcement of Kadira's error tracking system.','title':'Awesome Error Tracking Solution for Meteor Apps with Kadira'},
{'id':'1afff9dfb0b97b5882c72cb60844e034','author_id':'8dlx7ak38fd39dv79ad','author':'orinami','category':'product','body':'You might have seen the [EventLoop Utilization](http://support.kadira.io/knowledgebase/articles/372876-event-loop-utilization) chart in our Dashboard. But it was not correctly working across different hosting platforms. Actually, value that does not reflect any meaning in some situations.nn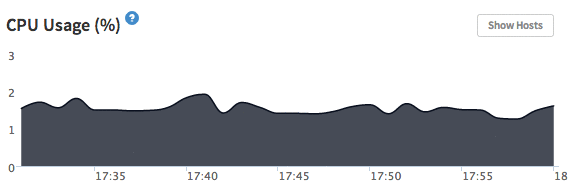nnSo, we've replaced EventLoop Utilization with [CPU Usage](http://support.kadira.io/knowledgebase/articles/378890-cpu-usage). It's the actual percentage of CPU spent on your app. Still, you need to be [careful](http://support.kadira.io/knowledgebase/articles/378890-cpu-usage) with analyzing CPU Usage because, some hosting providers have implemented CPU restrictions. But you can see the correct CPU Usage of your app.nnu003e Please upgrade [kadira](https://atmospherejs.com/package/kadira) smart package in order to track CPU Usage. Apply following code:nu003enu003e `mrt update`nn## How do we track CPU Usage?nnThere is no direct API to track CPU usage of your app within your app. But, we are using [usage](https://github.com/orinami/node-usage) npm module for that. In Linux and Solaris, it uses the **/proc** filesystem to read the CPU usage. So, it is very efficient.nnHave a good time with your improving application.','date':{'$date':'2014-06-12T00:00:00.000 Z'},'layout':'blog_post','slug':'tracking-cpu-usage-with-kadira','summary':'We've replaced EventLoop Utilization chart with actual CPU Usage. See why?','title':'Tracking Meteor CPU Usage with Kadira'},
{'id':'1bd16dfab1de982317d2ba4382ec8c86','author_id':'8dlx7ak38fd39dv79ad','author':'orinami','category':'meteor','body':'Today is for holiday Sri Lanka. But for me, it's a hackday. I started playing with React and wrote few simple apps. That's a nice experience.nnSo, I started thinking why not trying to implement SSR support. It's worth trying since now we've all the tools we need.nn**Guys, It was a successful experience. Now we've pure SSR support for Meteor.**nn### How It Works.nnLet's have a look at first.nn* Demo App: u003chttp://flow-react-ssr.meteor.com/u003en* Demo App Code: u003chttps://github.com/orinami/hello-react-meteoru003ennu003ciframe width="960" height="720" src="https://www.youtube.com/embed/Qj2eppT27BU?rel=0u0026amp;showinfo=0" frameborder="0" allowfullscreen="1"u003enu003c/iframeu003ennBasically, you just write your Meteor app as you do normally, but using React as the frontend. You use generic Meteor pub/sub to fetch data to the client and render your pages. nnHere, you need to use [FlowRouter](https://atmospherejs.com/meteorhacks/flow-router-ssr) and [ReactLayout](https://github.com/orinami/hello-react-meteor/blob/master/lib/react_layout.js) to render react components. ReactLayout is a pretty simple wrapper around `React.render()` which works both on the server and the client.nnIn the server, there is very interesting thing is happening. FlowRouter generate an isolated environment for each route. It use existing subscriptions to fetch data and them to assign collections in that environment. So, you don't need to any change of your code for the SSR support. nnThen when ReactLayout render components, it gets the data filtered by subscriptions for that route. (You can also use component level subscriptions.) nnAfter that ReactLayout handover the HTML to generate FlowRouter. This is designed in a way that we can add other layout engine support as well. So, FlowRrouter still doesn't directly works with the layout engine.nn### Where we can gonnThis is just the base work for SSR and there's a lot to be done to build a production ready version. But, now everything is clear and it's a matter of time we build and ship it. nnu003e This is the something we are going to release with FlowRouter 3.0. We are very close to release FlowRouter 2.0.nnI'll talk more about this in the upcoming **Kadira Show** and if you like to work on this, just drop me a message.','date':{'$date':'2015-07-01T00:00:00.000 Z'},'layout':'blog_post','slug':'meteor-ssr-support-using-flow-router-and-react','summary':'This is an experiment orinami did to implement Server Side Renderng(SSR) using Flow Router and React.','title':'Meteor Server Side Rendering Support with FlowRouter and React'},
{'id':'285292901bb38be8f57dd2885c517826','author_id':'8dlx7ak38fd39dv79ad','author':'orinami','category':'user-story','body':'[Brent Abrahams](http://cn.linkedin.com/pub/brent-abrahams/87/372/ba1) is a mathematics teacher who has build an online curriculum management app [Standbench](http://cn.linkedin.com/pub/brent-abrahams/87/372/ba1) organization for his using Meteor. He has a [nice story](http://meteorhacks.com/meteor-in-production-a-case-study.html) with the initial stage of his applications and how he used Oplog with his application.nnRecently, we was able to figure out a potential issue of one of his server with the data from Kadira. This is how he talked about it.nn"Kadira did give me a heads-up a couple of days ago that one of my servers was in trouble, as I saw an unusual increase in the number of publications and methods of being called. So I restarted the server and watched everything settle back into the normal pattern. That was nice! The real-time aspect of the Kadira admin console is just great."nnBrent also showed how he used Kadira with his development workflow.nnu003ciframe width="640" height="480" src="//www.youtube.com/embed/MUTn6hdfV64" frameborder="0" allowfullscreen="1"u003enu003c/iframeu003e','date':{'$date':'2014-05-27T00:00:00.000 Z'},'layout':'blog_post','slug':'user-stories-brent-abrahams','summary':'Denis has been using Kadira from the initial beta release and helped us a lot on identifying issues with Kadira. This is how he is using Kadira.','title':'How Brent is using Kadira with his development workflow'},
{'id':'2f6b59fd0b182dc6e2f0051696c70d70','author_id':'8dlx7ak38fd39dv79ad','author':'orinami','category':'other','body':'This is a short guide to remind you about means, histograms and percentiles in statistics. Then, we will discuss why all these matter and when we can use each of them.nn## Our Data SetnnFirst, we need a data set so we can calculate these measurements. We will look at a collection of response times collected over a minute from a web app. Here are those values (they are in milliseconds):nn~~~n255, 168, 125, 11102, 59, 120, 500, 2, 98, 25n~~~nnBy just looking at the set data, it's hard to get a clear picture. nIt would be impossible, if we had a larger data set. (Normally, we'll have larger data sets.)nnu003e You can access these values in a [Google Sheet](https://docs.google.com/spreadsheets/d/1JsDB2ryWKBcSLRy-YHIjfIs-ESFZq2k3N7ggdVz5O84/edit?usp=sharing), which also has each of the measurements we are looking at in this article.nn## Analyzing the Data SetnnNow we need to analyze this data set and get some information from it. That's why we need to build some measurements.nn## MeannnMean is the easiest measurement to generate. Simply add all the numbers together and divide by the number of items.nnFor this data set, the mean is **1245.4 milliseconds.**nnThat is on average it took more than 1245 milliseconds to process a single request.nnu003e The mean is a good for measurement representing a whole data set as a single value.nn## HistogramsnnSometimes mean **does not** represent a data set accurately. For our data set, we got a mean of 1245 milliseconds. But, just by looking at the data set, we know a lot of requests took less than 200 milliseconds. So, the mean is not a good representation for our data set.nnMean has a higher value because it's sensitive to **outliers** like 11,102 milliseconds.nnSo, a histogram is the answer. It gives us a better view of the data set.nnHere's the histogram for our data set:nn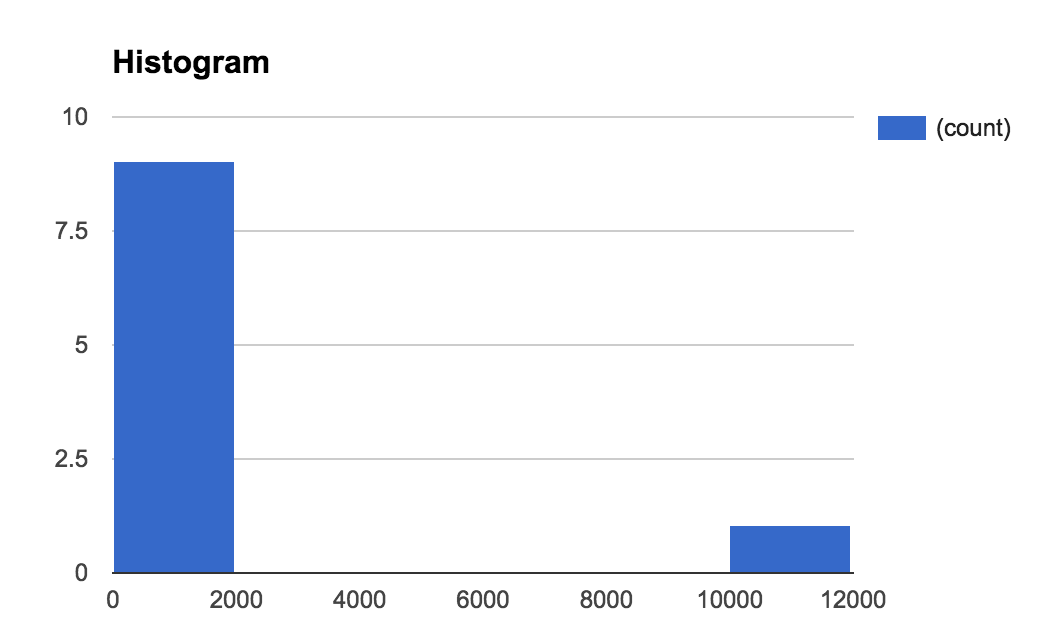nnIn the histogram, we group data points into equal groups. We call such a group a bin. The size of our bins (binSize) is 1000 milliseconds.nnIt's clear that we've an outlier. We can get even more information if we make our bin smaller size.nnu003e A histogram is a tool for good visualizing a data set. We can see what really happened.nn### SummarizingnnHistograms are always useful for visualizing a data set. But, we can't two different measure histograms and compare them easily. That's why we need to generate summary measurements from a histogram (or from the data set directly). nnLet's have a look at a few such measurements.nn#### MediannnMedian is the value in middle of the data set. We can simply get it by the sorting data set and picking the value in the middle. In our set data, it's **122.5 milliseconds.**nnWhat does the median represent? For 50% of the events, our response time was shorter than 125.5 milliseconds.nnu003e So, the median gives us useful information about our data set and it's not sensitive to outliers.nn#### PercentilesnnTo calculate a percentile, we need to sort our data set divide and it into 100 equal groups. So, the 90th percentile is the value at beginning of the 90th group.nnIn our case, the 90th percentile is **1560.2 milliseconds.**nnThis means that more than 10% of our user base experienced a response time of 1560 milliseconds or higher. Alternatively, 90% of our users had a response time less than 1560 milliseconds.nnu003e Median is equivalent to the 50th percentile. Percentiles are not sensitive to outliers.nn## Using All These MeasurementsnnWe can't say that one measurement is good or bad. Each of them has its own purpose. Let's discuss this. nnu003e We will use the *response time* as an example metric, but our comments hold for any kind of metric. nn**Mean is a good measurement if we need to compare response times in different periods.**nnFor example, we can plot means for each minute as a graph to see how it behaves. Since it's sensitive to outliers, we **can** see them as well. Have a look at the following graph:nn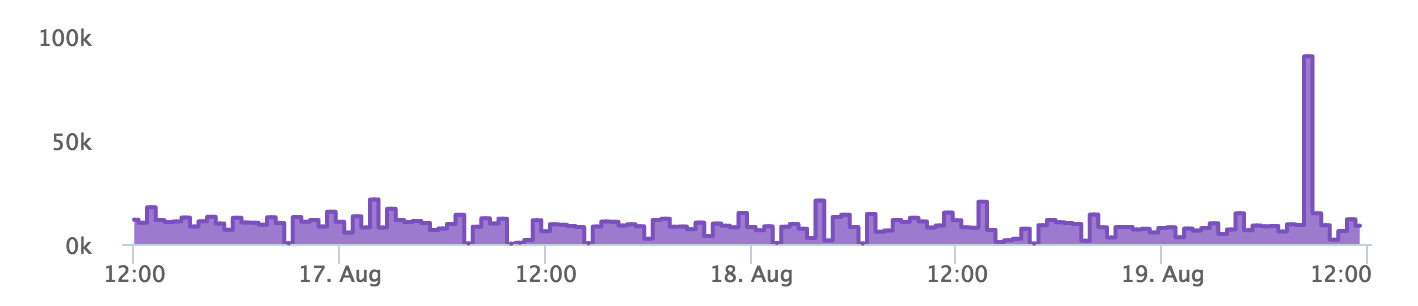nnThere's a spike at the end of this chart. So, we can tell that there was something wrong then. We can now drill down into the data set at that time and find the problem.nn**That's when histograms and summary measurements come in handy.**nnLet's have a look at the histogram of our data set at that time:nn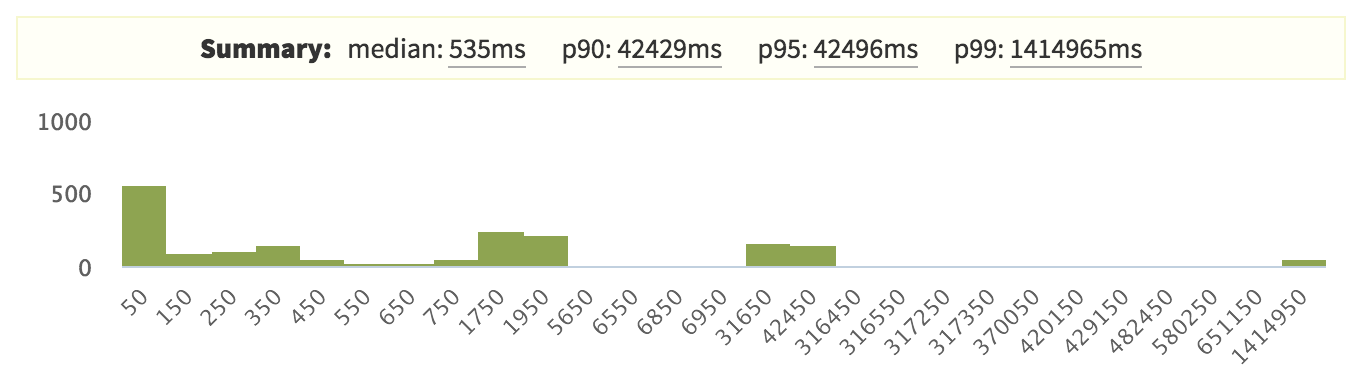nnHere, the 99th percentile is very high compared with the other percentiles, which indicates that there is an outlier.nnBut interestingly, our 90th and 95th percentiles are also quite high. So that seems like a problem.nnu003e Normally, we try to reduce response times. That's why we never look at lower percentile values like the 5th percentile. But, depending on your data set, you can pick any percentile you want.nnFor the response time, we usually look at the median, the 90th, 95th and 99th percentiles. It's up to you to decide which percentile you are going to look at. nnIf the response time is very critical to your app, you can try to reduce the 99th percentile. Otherwise, you could try to optimize the response time for the 90th or 95th percentile.nnIf you are really not worried about the response time, you could try to optimize the median.','date':{'$date':'2015-08-24T00:00:00.000 Z'},'layout':'blog_post','slug':'mean-histogram-and-percentiles','summary':'A short guide to means, histograms and percentiles and how we can use them in a real situation.','title':'Understanding Mean, Histogram and Percentiles'},
{'id':'3d7a3853bf435c0f00e46e15257a94d9','author_id':'8dlx7ak38fd39dv79ad','author':'orinami','category':'product','body':'Today, I'm very excited to be launching Kadira Debug version 2. This version comes with a lot of UI improvements and few CPU related functionalities.nn## InstallationnnThis version of Kadira Debug is published as a new package: `kadira:debug`. So, you need to remove `meteorhacks:kadira-debug` if it's in your app:nn~~~nmeteor remove meteorhacks:kadira-debugnmeteor add kadira:debugn~~~nnAfter you've added `kadira:debug`, simply visit u003chttp://debug.kadiraio.com/debugu003e and you'll be able to see what's going on in your app.nnLet me show you couple of new features and enhancements that we've added.nn### CPU Usage MonitoringnnThese days we do many things on the client side, which means there is a lot of CPU activities on the client side of your app. Sometimes, your app will become slower to use because of these activities.nnNow, we've a real-time CPU usage monitor based on [EventLoop usage](https://kadira.io/platform/kadira-debug/cpu-monitoring):nn[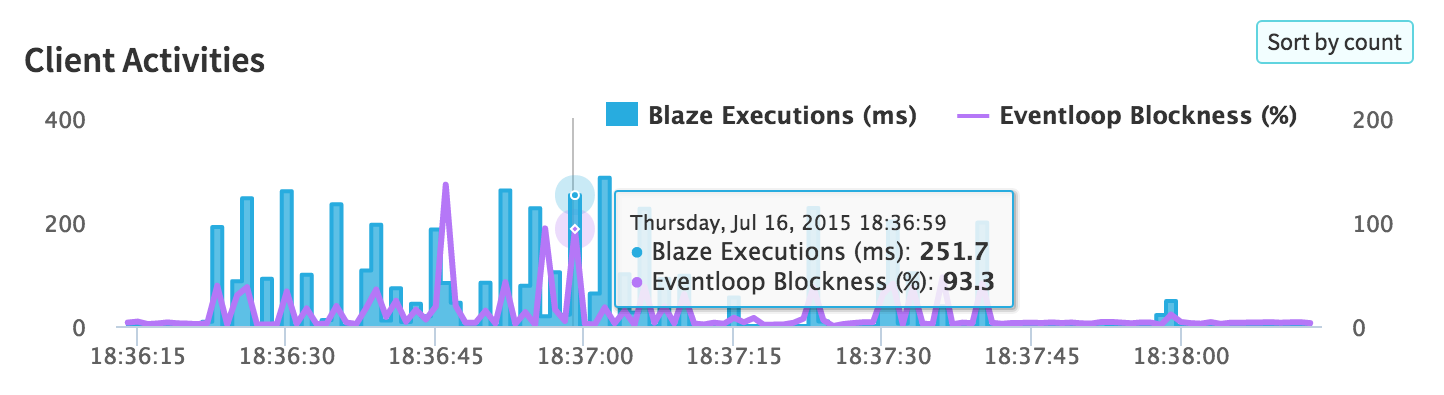](https://kadira.io/platform/kadira-debug/cpu-monitoring)nn### Improved Event StreamnnIn the previous version, the event stream was very hard to use if there was a lot of data in it. Now the event stream will pause if you click on it. Also, now you'll be able to filter the event stream for the data you actually need:nnu003ca href="https://kadira.io/platform/kadira-debug/event-stream"u003en u003cimg n src="https://cldup.com/i7bxh6m2WL.jpg" n alt="Improved Event Stream" n data-gif="https://cldup.com/aQC6-NFYNK.gif"/u003enu003c/au003enn### CPU ProfilingnnNow you can analyze both client and server CPU profiles using our CPU analyzer. Earlier it was only available inside our Kadira app and it was a bit hard to use. Now anyone can use it.nn[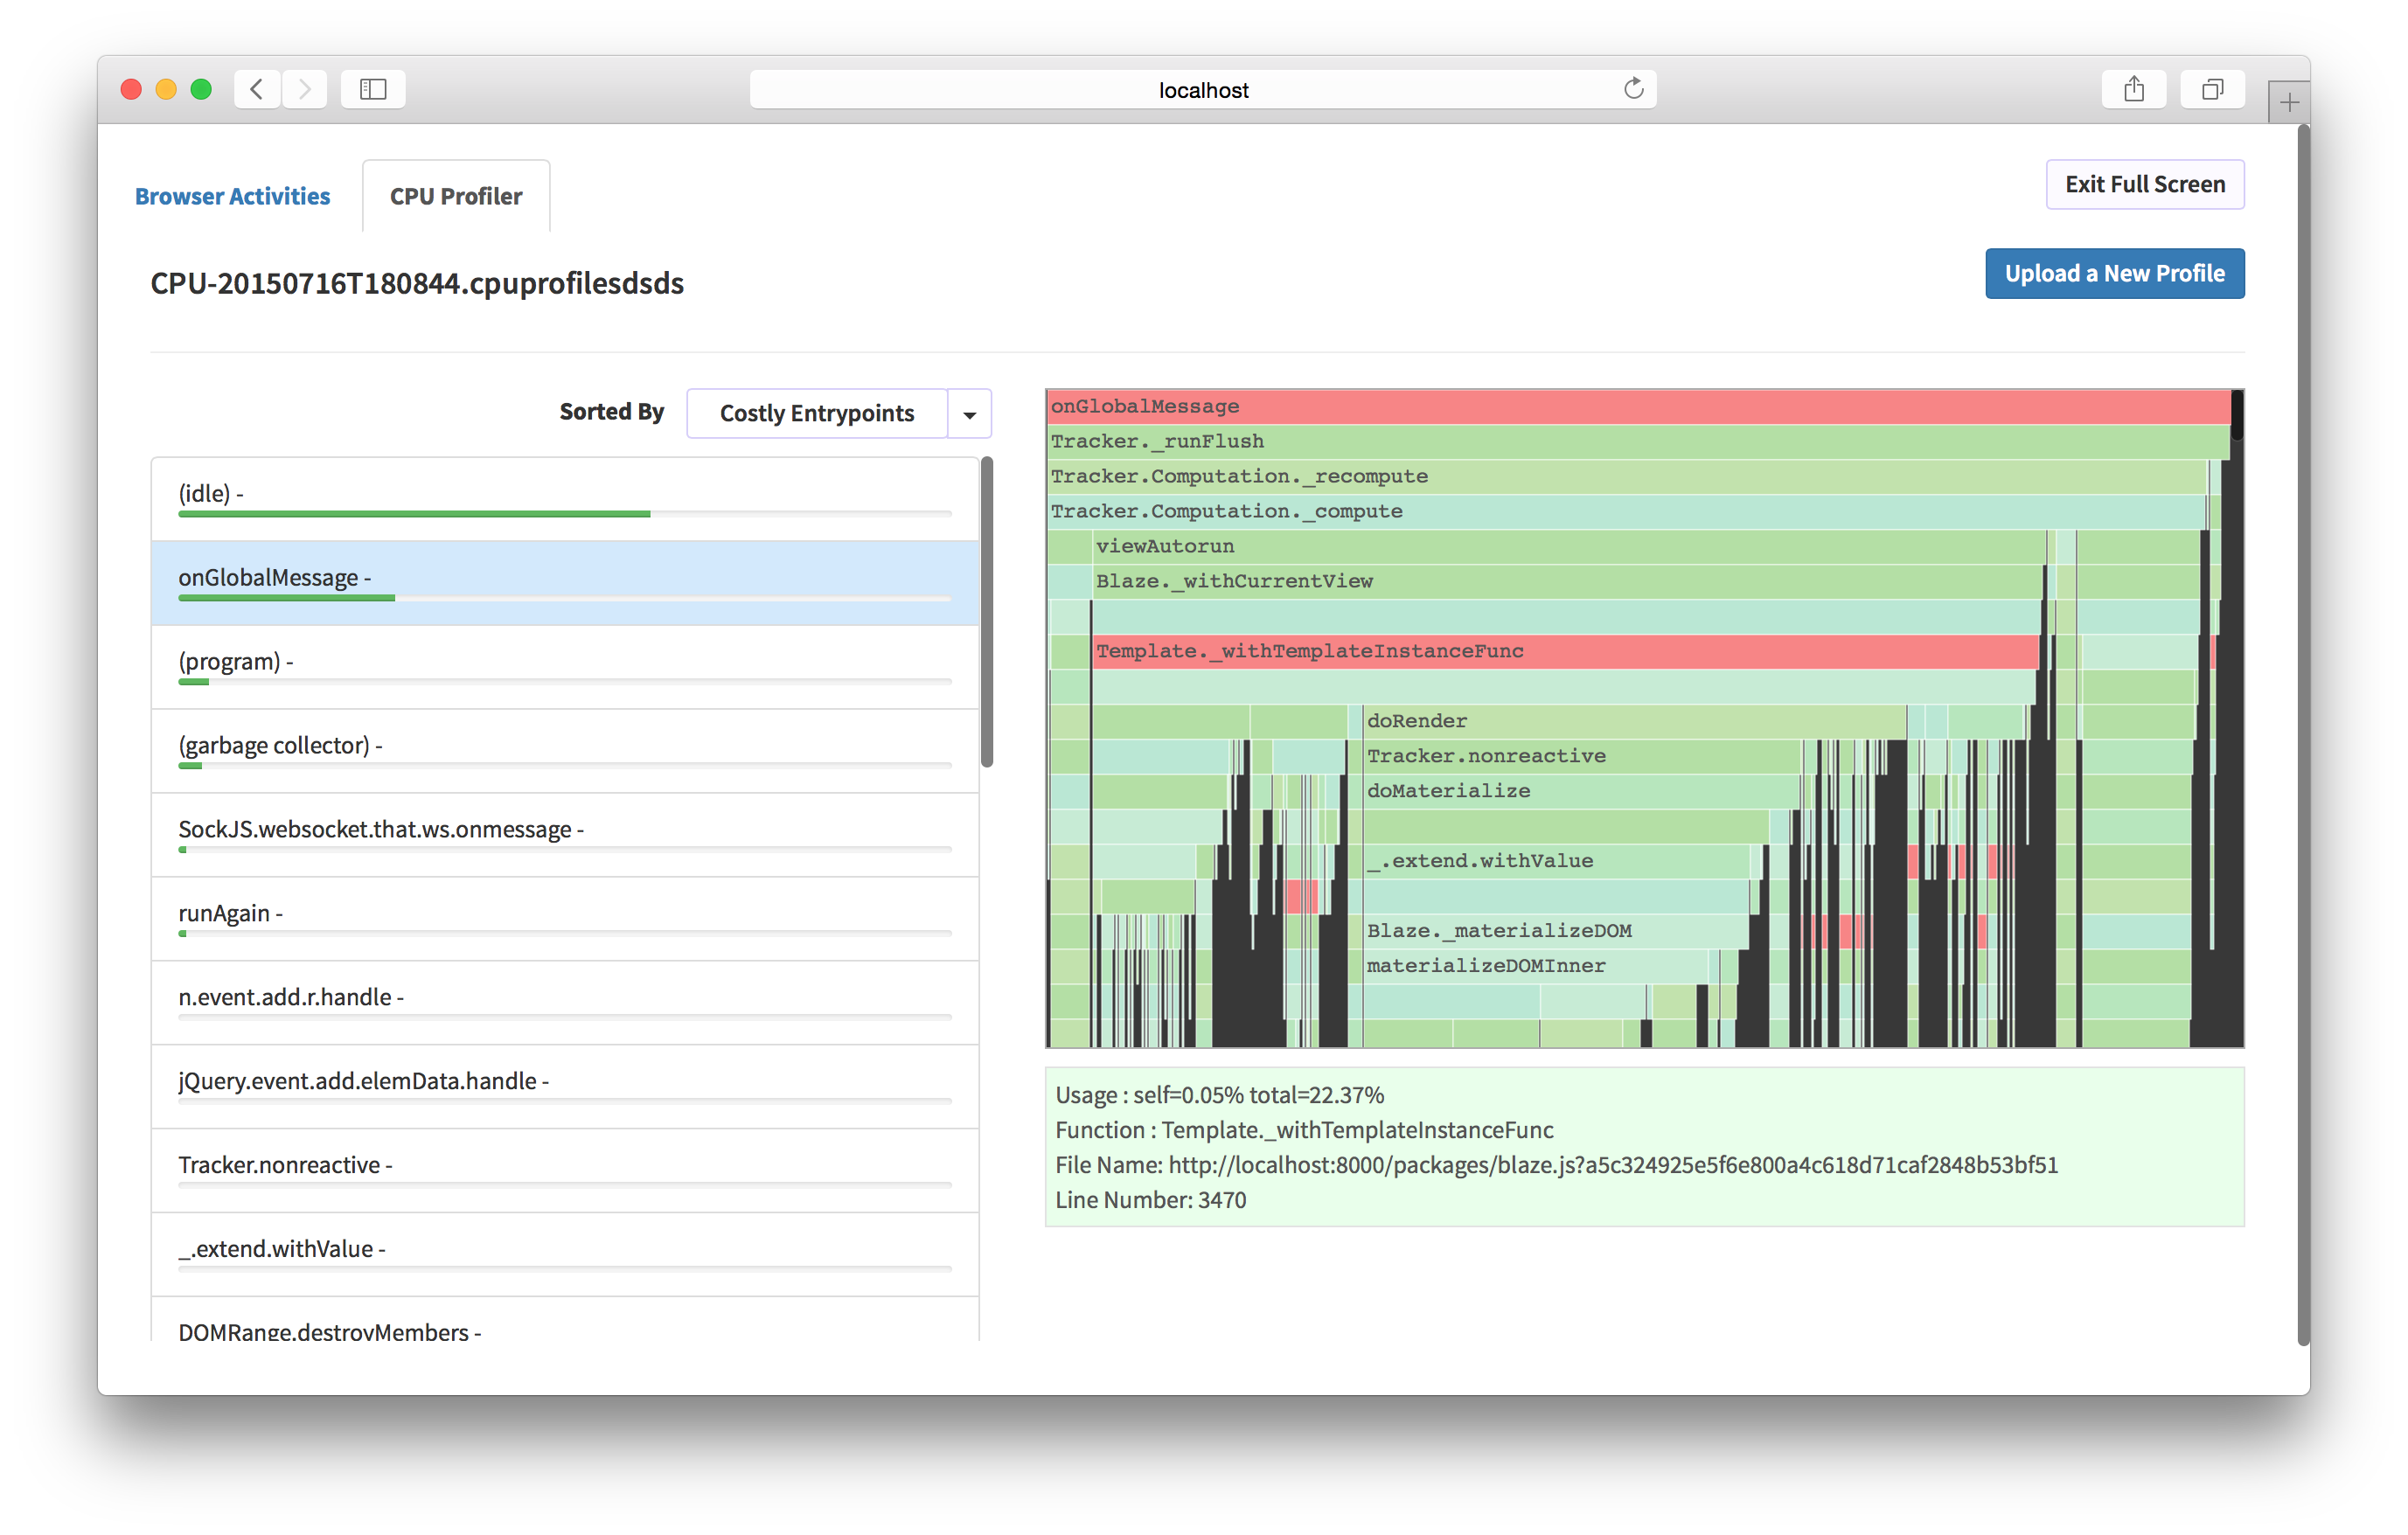](https://kadira.io/platform/kadira-debug/cpu-profiling)nn### Lots of UI ImprovementsnnBesides these major changes, we've added many UI improvements, making Kadira Debug very productive to use. nnTry the new [Kadira Debug](http://debug.kadiraio.com/debug) and let us know what you think about it.','date':{'$date':'2015-07-20T00:00:00.000 Z'},'layout':'blog_post','slug':'introducing-kadira-debug-v2','summary':'Today, we are introducing a new version of Kadira Debug. It comes with many UI improvements and support for CPU profiling.','title':'Introducing Kadira Debug, Version 2'}
];
module.exports = Posts;
Типи GraphQL
GraphQL має модуль ‘grapql/type’, використовуваний для визначення типу. Типи можуть бути імпортовані з модуля ‘graphql/type’ або з кореневого модуля ‘graphql’
Базові типи включають ID, String, Int, Float і Boolean. Ми ж ще додаємо тип Автор (Author). Для цього в наш файл schema.js додамо:
const AuthorType = new GraphQLObjectType({
 name: "Author",
 description: "This represent an author",
 fields: () => ({
 id: {type: new GraphQLNonNull(GraphQLString)},
 name: {type: new GraphQLNonNull(GraphQLString)},
 twitterHandle: {type: GraphQLString}
})
});
Як бачимо, для додавання нового типу нам знадобилося: створити об’єкт класу GraphQLObjectType і прописати деякі його властивості. Name і Description — для опису типу, Fields для визначення атрибутів типу Author: id, name і twitterHandler.
Більш детальніше про типи на graphql.org/graphql-js/type/
А тепер створимо тип для постів (Post):
const PostType = new GraphQLObjectType({
 name: "Post",
 description: "This represent a Post",
 fields: () => ({
 id: {type: new GraphQLNonNull(GraphQLString)},
 title: {type: new GraphQLNonNull(GraphQLString)},
 body: {type: GraphQLString},
 author: {
 type: AuthorType,
 resolve: function(post) {
 return _.find(Authors, a => a.id == post.author_id);
}
}
})
});
Додамо це до schema.js. Це створить об’єкт PostType, який буде використовуватися в Root Query( Дослівно — кореневої запит. По суті, точка входу до нашого GraphQL API).
Root Query
Root Query використовується для розкриття ресурсів, доступних клієнтам вашого додатка. Ми б могли зробити 2 ресурсу доступними: автори і пости.
Давайте додамо в наші файл `schema.js`:
const BlogQueryRootType = new GraphQLObjectType({
 name: 'BlogAppSchema',
 description: "Blog Application Schema Query Root",
 fields: () => ({
 authors: {
 type: new GraphQLList(AuthorType),
 description: "List of all Authors",
 resolve: function() {
 return Authors
}
},
 posts: {
 type: new GraphQLList(PostType),
 description: "List of all Posts",
 resolve: function() {
 return Posts
}
}
})
});
Тут кореневої запит визначено як BlogQueryRootType. Якщо ви помітили, тут був оголошений новий тип: new GraphQLList(). Він створює обгортку навколо інших типів, яка представляє список цих типів.
Визначення схеми
Схема визначає, як ви хочете, щоб дані у вашому додатку були сформовані і як ви хочете, щоб дані були пов’язані один з одним. Визначення схеми впливає на те, як дані будуть зберігатися у вашій базі даних (або в базах даних). В визначенні схеми ви також визначаєте, які запити, мутації і підписки будуть доступні для вашого інтерфейсу, що відображає дані.
Давайте додамо схему в наш файл:
const BlogAppSchema = new GraphQLSchema({
 query: BlogQueryRootType
 /* Якщо вам знадобитися створити або
 оновити дані, ви повинні використовувати
 мутації.
 Мутації не будуть вивчені в цьому пості.
 mutation: BlogMutationRootType
*/
});
Тут запитом присвоюється об’єкт BlogQueryRootType, який буде використовуватися в якості кореневого запиту API.
Реалізація GraphQL API
Нам знадобитися пакет `lodash`. `Lodash` це інструментарій, який представляє собою Javascript функції, які забезпечують чисті, високопродуктивні методи для маніпуляції з об’єктами і колекціями. Якщо ви були знайомі з бібліотекою `underscore`, це здорово! Lodash був створений з нього, додавши додаткову функціональність і вирішивши деякі проблеми з продуктивністю underscore.
npm install lodash --saveЗа допомогою цієї команди буде встановлена бібліотека lodash і додана відповідна залежність у package.json файл.
Додамо наступний код у верхню частину файлу schema.js.
const _ = require('lodash');Тепер давайте подивимося в файл schema.js. Ось як файл повинен виглядати в кінцевому підсумку.
const _ = require('lodash');

// Authors і Posts отримують дані у вигляді
// JSON масивів з відповідних файлів
const Authors = require('./data/authors');
const Posts = require('./data/posts');

let {
 // Тут базові типи GraphQL, які потрібні в цьому уроці
GraphQLString,
GraphQLList,
GraphQLObjectType,
 /* Це необхідно для створення вимог
 до полів і аргументам */
GraphQLNonNull,
 // Цей клас нам потрібен для створення схеми
GraphQLSchema
} = require('graphql');

const AuthorType = new GraphQLObjectType({
 name: "Author",
 description: "This represent an author",
 fields: () => ({
 id: { type: new GraphQLNonNull(GraphQLString)},
 name: { type: new GraphQLNonNull(GraphQLString)},
 twitterHandler: {type: GraphQLString}
})
});

const PostType = new GraphQLObjectType({
 name: "s",
 description: "This represent a s",
 fields: () => ({
 id: {type: new GraphQLNonNull(GraphQLString)},
 title: {type: new GraphQLNonNull(GraphQLString)},
 body: {type: GraphQLString},
 author: {
 type: AuthorType,
 resolve: function(post) {
 return _.find(Authors, a => a.id == post.author_id);
}
}
})
});

const BlogQueryRootType = new GraphQLObjectType({
 name: "BlogAppSchema",
 description: "Blog Application Schema Query Root",
 fields: () => ({
 authors: {
 type: new GraphQLList(AuthorType),
 description: "List of all Authors",
 resolve: function() {
 return Authors
}
},
 posts: {
 type: new GraphQLList(PostType),
 description: "List of all Posts",
 resolve: function() {
 return Posts
}
}
})
});

const BlogAppSchema = new GraphQLSchema({
 query: BlogQueryRootType
 /* Якщо вам знадобитися створити або
 оновити дані, ви повинні використовувати
 мутації.
 Мутації не будуть вивчені в цьому пості.
 mutation: BlogMutationRootType
*/
});

module.exports = BlogAppSchema;
Якщо ви помітили в PostType, ми маємо додатковий атрибут resolve. Resolve являє собою функцію, яка може маніпулювати з даними, перетворити їх значення і т. д. і повертати їх кінці операції.
BlogAppSchema буде експортовано в server.js файл, використовуючи module.exports
Тепер, створіть файл server.js у кореневій папці і додайте цей код:
const express = require('express');
const graphqlHTTP = require('express-graphql');
const schema = require('./src/schema.js');

let port = 3000;
const app = express();
app.use('/', graphqlHTTP({
 schema: schema,
 graphiql: true
}));

app.слухати(port);
console.log('GraphQL API server running at localhost:'+ port);
Зараз перевіримо наш результат на localhost:3000. Для цього відкрийте термінал і виконайте:
node server.jsРезультат:

Це graphiql, він допоможе вам протестувати API в браузері. Так наступний запит:
{
 posts {
id
title
 author {
name
}
}
}
Дасть результат на зразок цього:

Висновок
Я так радий, що закінчив цей урок з вами. Тепер ви знаєте, як створити GraphQL API на основі Express і NodeJS. Я сподіваюся, що урок був цікавим і ви багато дізналися з нього.
Якщо ви хочете дізнатися більше про GraphQL відвідайте graphql.org.


